The University of Southampton

Plants Revealed to be More Efficient at Higher CO2 Levels

As we enjoy a varied diet of carbohydrates, proteins and fats, for plants it is the gas carbon dioxide (CO2), water and sunlight (figure. 1).

Figure. 1 Pedunculate Oak Tree; a temperate plant species that could be impacted by changing atmospheric conditions.
Figure. 1 Pedunculate Oak Tree in sunlight (Lind).

It is not just CO2 use which is made more efficient at elevated CO2 levels, water efficiency is greater as less water is lost from leaf pores; stomata. FACE (Free-Air CO2 Enrichment) experiments with soybean show that leaf pore conductance is not adapted to elevated CO2 but rather maintain decreased conductance. Furthermore, this increase in water efficiency is consistent between the leaf and canopy levels (Leakey et al, 2009).


It was also thought that higher CO2 levels lead to increased efficiency of nitrogen, a mineral required for growth, as plants grown at these levels do not have as much nitrogen present. These high CO2 grown plants also have a greater biological mass than those grown at normal CO2 conditions. However these CO2 levels where not found to affect levels of biological mass attained over plant lifetime which indicates that an accelerated period of growth that used up nitrogen reserves (Coleman et al, 1993). Increased CO2 levels are thought to contribute to increased uptake of nitrogen by plant roots rather than increased plant efficiency regarding nitrogen. Further FACE experiments at three separate forest locations showed that increased biological mass corresponded to increased nitrogen uptake from the soil. However this is limited to areas where nitrogen soil supply exceeds demand and is therefore unlikely to be seen in all plants worldwide (Finzi et al, 2007).


These FACE experiments are advantageous as they allow CO2 to be applied to a specific area of a wide range of ecosystems from desert to tropical forest. Trees as tall as 25m can be used in these experimental plots which can be as large as 30m in dimeter (Norby and Zak, 2011).


Figure.1 Atmospheric carbon dioxide (CO2) levels from 1950-2010 (IPCC, 2013)
Figure.2 Atmospheric carbon dioxide (CO2) levels from 1950-2010 (IPCC, 2013)

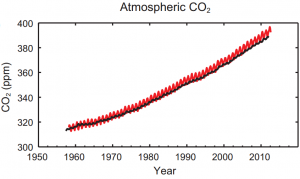
Scientists have been documenting rising atmospheric CO2, which is associated with planetary warming, for almost 70 years now, since 1950 (figure. 2). It is widely accepted that this change in CO2 has arisen from human industrialisation. While it seems that plants can positively cope with this change this conclusion must not be taken at face value and further studies must be undertaken.


  • Coleman, J.S., McConnaughay, K. D. M and Bazzaz, F. A. (1993). Elevated CO2 and Plant Nitrogen-Use: is reduced Tissue Nitrogen Concentration Size Dependent?. Oecologia. 93, 195-200.
  • Drake, B. G., Gonzalez-Meler, M. A and Long, S. P. (1997). More Efficient Plants: a Consequence of Rising Atmospheric CO2. Ann. Rev. Plant. Physiol. 48, 609-639.
  • Finzi, A. C., Norby, R. J., Calfapietra, C., Gallet-Budynek, A., Gielen, B., Holmes, W. E., Hoosbeek, M. R., Iversen, C. M, Jackson, R. B., Kubiske, M. E, Ledford, J., Liberloo, M., Oren, R., Polle, A., Pritchard, S., Zak, D. R., Schlesinger, W. H and Ceulemans, R. (2007). Increased in Nitrogen Uptake rather than Nitrogen-Use Efficiency support higher rates of Temperate Productivity under Elevated CO2. PNAS. 104 (35), 14014-14019.
  • IPCC, 2013: Summary for Policymakers. In: Climate Change 2013: The Physical Science Basis. Contribution of Working Group I to the Fifth Assessment Report of the Intergovernmental Panel on Climate Change [Stocker, T.F., D. Qin, G.-K. Plattner, M. Tignor, S. K. Allen, J. Boschung, A. Nauels, Y. Xia, V. Bex and P.M. Midgley (eds.)]. Cambridge University Press, Cambridge, United Kingdom and New York, NY, USA.
  • Leakey, A. D. B., Ainsworth, E. A., Bernacchi, C. J., Rogers, A., Long, S.P and Ort, D. R. (2009). Elevated CO2 Effects on Plant Carbon, Nitrogen and Water Relations: six important lessions from FACE. Journal of Experimental Botany. 60 (10), 2859-2876.
  • Lind, J. © Photo of Pedunculate Oak Tree. Available: http://www.arkive.org/pedunculate-oak/quercus-robur/image-A20783.html. Last accessed 20th March 2017.
  • Norby, R. J and Zak, D. R. (2011). Ecological Lessons from Free-Air CO2 Enrichment (FACE) Experiments. Annual Review of Ecology, Evolution and Systematics. 42. 181-203.

[480 words]


Human’s naivety towards artificial manipulation of the nitrogen cycle has devastating effects for aquatic ecosystems!

Why care about nitrogen?

natural-nitrogen
Figure 1. Growth of marine plants affected solely by natural nitrogen sources. Source: https://www.esa.org/
artificial-nitrogen
Figure 2. Growth of marine plants affected by artificial nitrogen sources, showing increased algae growth and limited oxygen availability. Source: https://www.esa.org
dead_fish0834
Figure 3. Death of trout, as a result of reduced oxygen availability. Source: http://www.edupic.net


Nitrogen ranks fourth as the most common chemical element in living tissues. Before human contribution to the nitrogen content in the atmosphere, nitrogen was a major limiting factor controlling the functioning of ecosystems (Marris, 2008)! Despite 78% of earth’s atmosphere being nitrogen, most plants and animals must wait for the nitrogen to be ‘fixed’. This occurs through its bonding with hydrogen or oxygen to form ammonium and nitrate (Fields, 2004).

The current measurement of fixed nitrogen occurs in tetragrams (Tg), which is equal to a million metric tons of nitrogen. It is estimated that the rate of natural nitrogen fixation on land is 140Tg of N per year (Vitousek et al., 1997). Surprisingly, human activities have resulted in an extra artificial nitrogen fixation of 218Tg of N per year (Vitousek et al., 1997)!

nitrogen-cycle
Figure 4. Human-driven global nitrogen changing factors have increased in a similar trend to that of the human population, except for industrial N fertilizer, which has increased at a far greater rate – growing exponentially in 1975. Source: https://www.esa.org

More worryingly is that by 2050, if predicted population trends are accurate then artificial N fixation will reach four times that of the natural production rate(Tilman & Lehman, 2001)!

Why is this important?

One of the biggest problems nitrogen poses to aquatic ecosystems, is its ability to form nitric acid through complex chemical reactions! This acid results in increasing the concentration of H+ in freshwater environments. This results in the PH of the water decreasing. A decreasing PH can result in an increase in the concentration of trace metals (Lee & Saunders, 2003). This occurs due to decreased metal sedimentation. The settling of dissolved aluminium reduces phosphate availability and therefore affects the phosphate cycle (Camargo & Alonso, 2006).

This is devastating! Phosphates are involved in the formation of ATP during respiration, and this ATP is essential for the normal functioning of an organisms metabolism, and without proper functionality, death will occur. A PH below 6 seems to be the threshold for significant damage. In fish, arrested development of embryos can occur, resulting in skeletal deformities (Camargo & Alonso, 2006).

fish-embryo
Figure 5. Zebrafish embryos at normal oxygen conditions (normoxia) and severe hypoxia conditions (anoxia), showing the developmental arrest of embryos. Source: https://www.ncbi.nlm.nih.gov/pmc/articles/PMC34668

High nitrogen levels can disrupt ionic regulation, which results in molluscs, insects, fish and amphibians suffering from a deficit in calcium. This causes issues with bone development and shell maturation. In terms of the food chain, the reduced PH of aquatic environments causes a depression of net photosynthesis in planktonic and attached algae (Eisler, 2012) . This is due to the increased growth of algae which can ‘cloud’ the water preventing light penetration, as well as through disproportional oxygen consumption.

Moreover, the decline in dissolved oxygen can promote the production of hydrogen sulphide by anaerobic bacteria. Hydrogen sulphide can further reduce the availability of oxygen, due to it accumulating at the waters surface (Smith & Oseid, 1974)! This is a huge problem as dissolved oxygen is essential to the respiration of aquatic organisms, and without it, death is inevitable!

Are humans really responsible?

In short, yes, we are to blame!

table

If the current trend continues, not only will the current effects be amplified, resulting in a greater number of deaths, but the cost of aquatic organisms as a source of food will sky-rocket!

References

Camargo J, Alonso Á. (2006). Ecological and toxicological effects of inorganic nitrogen pollution in aquatic ecosystems: A global assessment. Environment International, 32(6), pp.831-849.

Eisler R. Oceanic acidification. (2012). 1st ed. Boca Raton: CRC Press

Fields S. (2004). Global Nitrogen: Cycling out of Control. Environmental Health Perspectives, 112(10), pp.556-563.

Lee M, Saunders J. (2003). Effects of pH on Metals Precipitation and Sorption: Field Bioremediation and Geochemical Modeling Approaches. Vadose Zone Journal, 2(2):, pp.77-185.

Marris, E. (2008). Nitrogen pollution stomps on biodiversity. Nature, 1, pp.1-3.

Smith L, Oseid D. (1974). Effect of Hydrogen Sulfide on Development and Survival of Eight Freshwater Fish Species. The Early Life History of Fish, 1, pp.417-430.

Tilman D, Lehman C. (2001). Human-caused environmental change: Impacts on plant diversity and evolution. Proceedings of the National Academy of Sciences, 98(10), pp.5433-5440.

Vitousek, P., Aber, J., Howarth, R., Likens, G., Matson, P., Schindler, D., Schlesinger, W. and Tilman, D. (1997). Technical Report: Human Alteration of the Global Nitrogen Cycle: Sources and Consequences. Ecological Applications, 7(3), pp.737-750

[word count: 487]